Justifying Quick in QuickNode: A Response Time Comparison of Blockchain Node Providers
We compare and discuss the blockchain RPC response times of various blockchain node providers — QuickNode, Alchemy, Ankr, Blockdaemon, Chainstack, GetBlock, Infura, and Pokt Network — to conclude who is the fastest.

A couple of decades ago, an average Internet user would have been satisfied with an email delivered to the recipient in a few minutes. However, today, it's a different case — a product would not see the light if it's not fast enough. "Speed helped make the internet what it has become."
Similarly, one of the primary causes hindering the mainstream adoption of Web3 is the overall user experience (UX). The poor UX of Web3 applications can be pinned down to many things, mainly the application performance — speed.
Application Performance In Web3
Application performance is a broad term covering many aspects, but we can boil it down to measuring an application's real-world performance and availability. More specifically (maintaining the context of this article), it's how fast the application loads and responds to user interactions. Whether Web2 or Web3, this is a crucial aspect of any application's adoption. While much has been done in the Web2 space to tackle this issue, the Web3 domain is still struggling.
A Case for Performance — Why Does It Matter?
According to research, 47 percent of users will leave a website if it does not load in two seconds, and 70 percent of mobile app users will abandon an app if it takes too long to load. It means the users would jump ship in favor of a competitor due to inadequate performance.
With Web3, this performance stack has an additional layer: continuous interaction with the blockchain. An event doesn't exist if it's not recorded on the blockchain, i.e., there's an always-on blockchain communication layer in any Web3 application.
Imagine running a DeFi / DEX aggregator like 1inch, providing a non-custodial wallet solution like Exodus, or presenting an NFT marketplace like MagicEden. Could you risk your application performance because of this blockchain communication layer? The answer should be clear.
Innovation of Fast Blockchains
The days of Bitcoin are far behind when one had to wait long for transactions to be processed. After the advent of Ethereum, things changed massively. Additionally, Layer 2 solutions built on Ethereum enhanced its efficiency. And then blockchains like Solana took it a step further by eyeing a throughput of 65,000 transactions per second (TPS), with a theoretical throughput of 710,000 TPS in the future. The blockchain space is advancing rapidly; however, these numbers would become a reality only when the underlying infrastructure is robust enough to support the ambitious goals of these blockchains.
Introducing Blockchain Node Providers
Unlike in earlier days when you could run a node on an ordinary computer, things have changed drastically. Running a node now to support your production-ready application requires ample resources — it can be hectic. You not only require costly hardware with massive specifications to set up and run the node, but you also need a full-proof plan to manage that infrastructure regularly. And, with time, these requirements are set to increase. For example, when writing this article, Solana requires a minimum of 12 cores CPU with 128 GB RAM to run its blockchain client.
Node providers come in to solve this dilemma. They run and manage blockchain nodes in-house and usually provide end-users access over an API endpoint, often utilizing blockchain RPC technology. RPC providers act as a bridge between the application and the blockchain, allowing developers to interact with the blockchain without the need to run a full node themselves. As stated earlier, running and managing nodes takes much work, so most of the industry players, including prominent ones, trust and leverage the services of these node providers to power their applications.
Lately, we have seen many new players emerge in this industry, claiming to be the fastest node provider without any evident data. Hence, it's crucial to quantify the quality of the providers transparently as we move forward. In the following sections, we will define a methodology and then compare and discuss the response times of various blockchain node providers in the Web3 space, taking into account factors such as their infrastructure, API performance, and utilization of blockchain RPC technology.
Methodology for Comparing Response Time of Blockchain Node Provider Services
We have seen many tools and discussions pop up in the recent past comparing the response time of blockchain node provider services. However, most of them are flawed at the methodological level — doing one-off tests, using free tier accounts, testing easily cacheable methods, tampering with data as a part of the methodology, etc. Hence, it's essential to have an unbiased and neutral approach to perform this comparison and also build this model realistically.
What Is Response Time?
Before diving into other things, it's essential to understand that response time is not solely latency. It's the summation of the round-trip time (RTT) and the service time, i.e., the total time taken for a request to reach the destination, be processed, and sent back to the source as a response. The response time can be divided into multiple layers — DNS resolution time, TCP connection time, SSL handshake time, time to first byte, and download time. Understanding this is the foundation for building a solid response time comparison methodology for blockchain node provider services.
Creating a Realistic Comparison Model
We have laid down the critical points required to ensure complete fairness when running the tests and gathering the data, as well as replicating a real-world use case:
- Paid accounts - Most providers comment that their free tier is not the most performant. Therefore, using a paid account (wherever available) is crucial.
- Not easily cacheable blockchain RPC method - Some blockchain methods are easily cacheable and can be served without putting any stress on the system. So, choosing an RPC method that engages the system and puts some pressure on it would be essential.
- Multiple cloud/hosting providers - Running the tests using a cloud/hosting provider where self-infrastructure is hosted can introduce a considerable bias. Hence, the tests must be run using multiple unrelated cloud/hosting providers.
- Multiple locations - Node performance can differ from region to region due to various factors — what looks good from the US may not look good from the EU, and vice-versa. Hence, the tests must be executed from multiple locations globally.
- Concurrent test calls - The state of blockchains changes every second, so conducting these tests one after another can paint inaccurate response times. Thus, the test calls should be made concurrently for all the providers.
- Continuous and frequent tests - The real-world use of blockchain nodes is persistent and doesn't stop. To replicate this use case, running tests and collecting data frequently for an extended period is vital.
- Untampered data - When critically analyzing data, it's imperative to have unbiased and unmodified data, which means the data should be passed to the next stage without manipulation.
Executing the Proposed Model
Following the above points, we developed an internal tool for this purpose, QuickLee. It ticks all the boxes:
- We created paid accounts/API endpoints for the following services and are using those in the tests:
a. Alchemy
b. Ankr
c. Chainstack
d. GetBlock
e. Infura - We are making test calls using the eth_getBalance RPC method (for all the EVM-based chains). This method queries the balance of a wallet address at a specific block height (the latest in our case). Also, the wallet address used as the parameter remains the same for all the tests.
- We are using multiple cloud/hosting providers for these tests, where QuickNode doesn't host their infrastructure (while the others do, which is acceptable to us):
a. Amazon Web Services (AWS)
b. Digital Ocean (DO) - With multiple cloud/hosting providers, we have also set up multiple servers in various geographical locations globally:
a. AWS
i. Ohio (US-E)
ii. Northern California (US-W)
iii. Frankfurt (EU)
iv. Tokyo (AP)
b. DO
i. New York (US-E)
ii. London (EU)
iii. Singapore (AP) - We have created a script using Golang that makes concurrent test calls to all the providers at a defined interval.
- The calls are made once every 10 seconds, which means we have 6 data points for each provider every minute.
- The test data is piped (without any interference) into DataDog. Each test—call — records the total response time along with other metadata, such as the response status code.
Visualizing the Data
Using the data received in Datadog, we create multiple charts to answer various questions. These charts reflect the results in the selected timeframe.
What's the Average Response Time and Availability of Each Node Provider?
We have created an Overview table with multiple columns — Name, Average Response Time, Total Calls, Failed Calls, and Availability — sorted based on the Average Response Time.
- Average Response Time is aggregated by Datadog using the response time (data points).
- Total Calls are the total number of calls made to a provider, and Failed Calls are the number of failed calls for that provider.
- Availability is a percentage value calculated using Total Calls and Failed Calls:
((Total Calls - Failed Calls) / Total Calls) * 100
Which Node Provider Is the Fastest and Most Stable — Globally and Across Various Regions?
Every region-specific section — Global, US (United States), EU (Europe), AP (Asia-Pacific) — has a Top List and a Timeseries Graph.
- The Top List is populated based on the average response time in the region and is sorted from lowest to highest.
- The Timeseries Graph is a line chart drawn using the average response time. We have also applied a 5-point rolling median function to the chart to remove the outliers and cleanly visualize the stability. Furthermore, we have used a log scale graph instead of a linear one with the y-axis marker set to 750ms to enhance chart readability.
Results and Discussion
Though we are running these tests for multiple chains, we will do a case study on Ethereum in this article (Live dashboards for all the chains are available in the Appendix). To compare and discuss, we will use two weeks of data — from Nov 9, 2022, 12:00 UTC to Nov 23, 2022, 12:00 UTC. This timeframe amounts to almost 5 million data points, sufficient to make a fair comparison with around 600k calls made to each node provider.
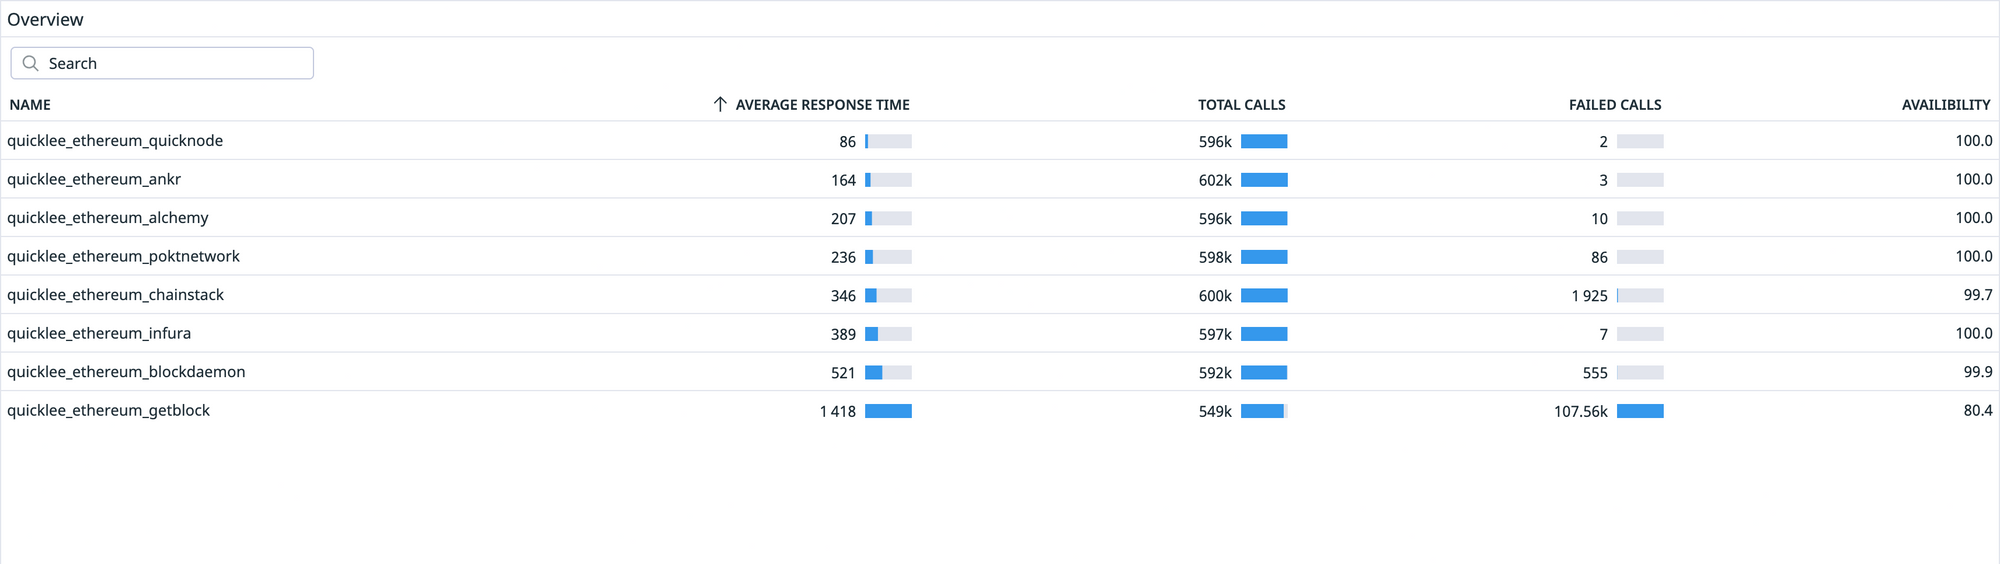
From an availability perspective, all the providers were able to hit the 99.9% mark except for GetBlock (80.4%) and Chainstack (99.7%). QuickNode had the least number of failed calls (2), followed by Ankr (3) and Infura (7).
PS: GetBlock reported an attack on their services during this period.
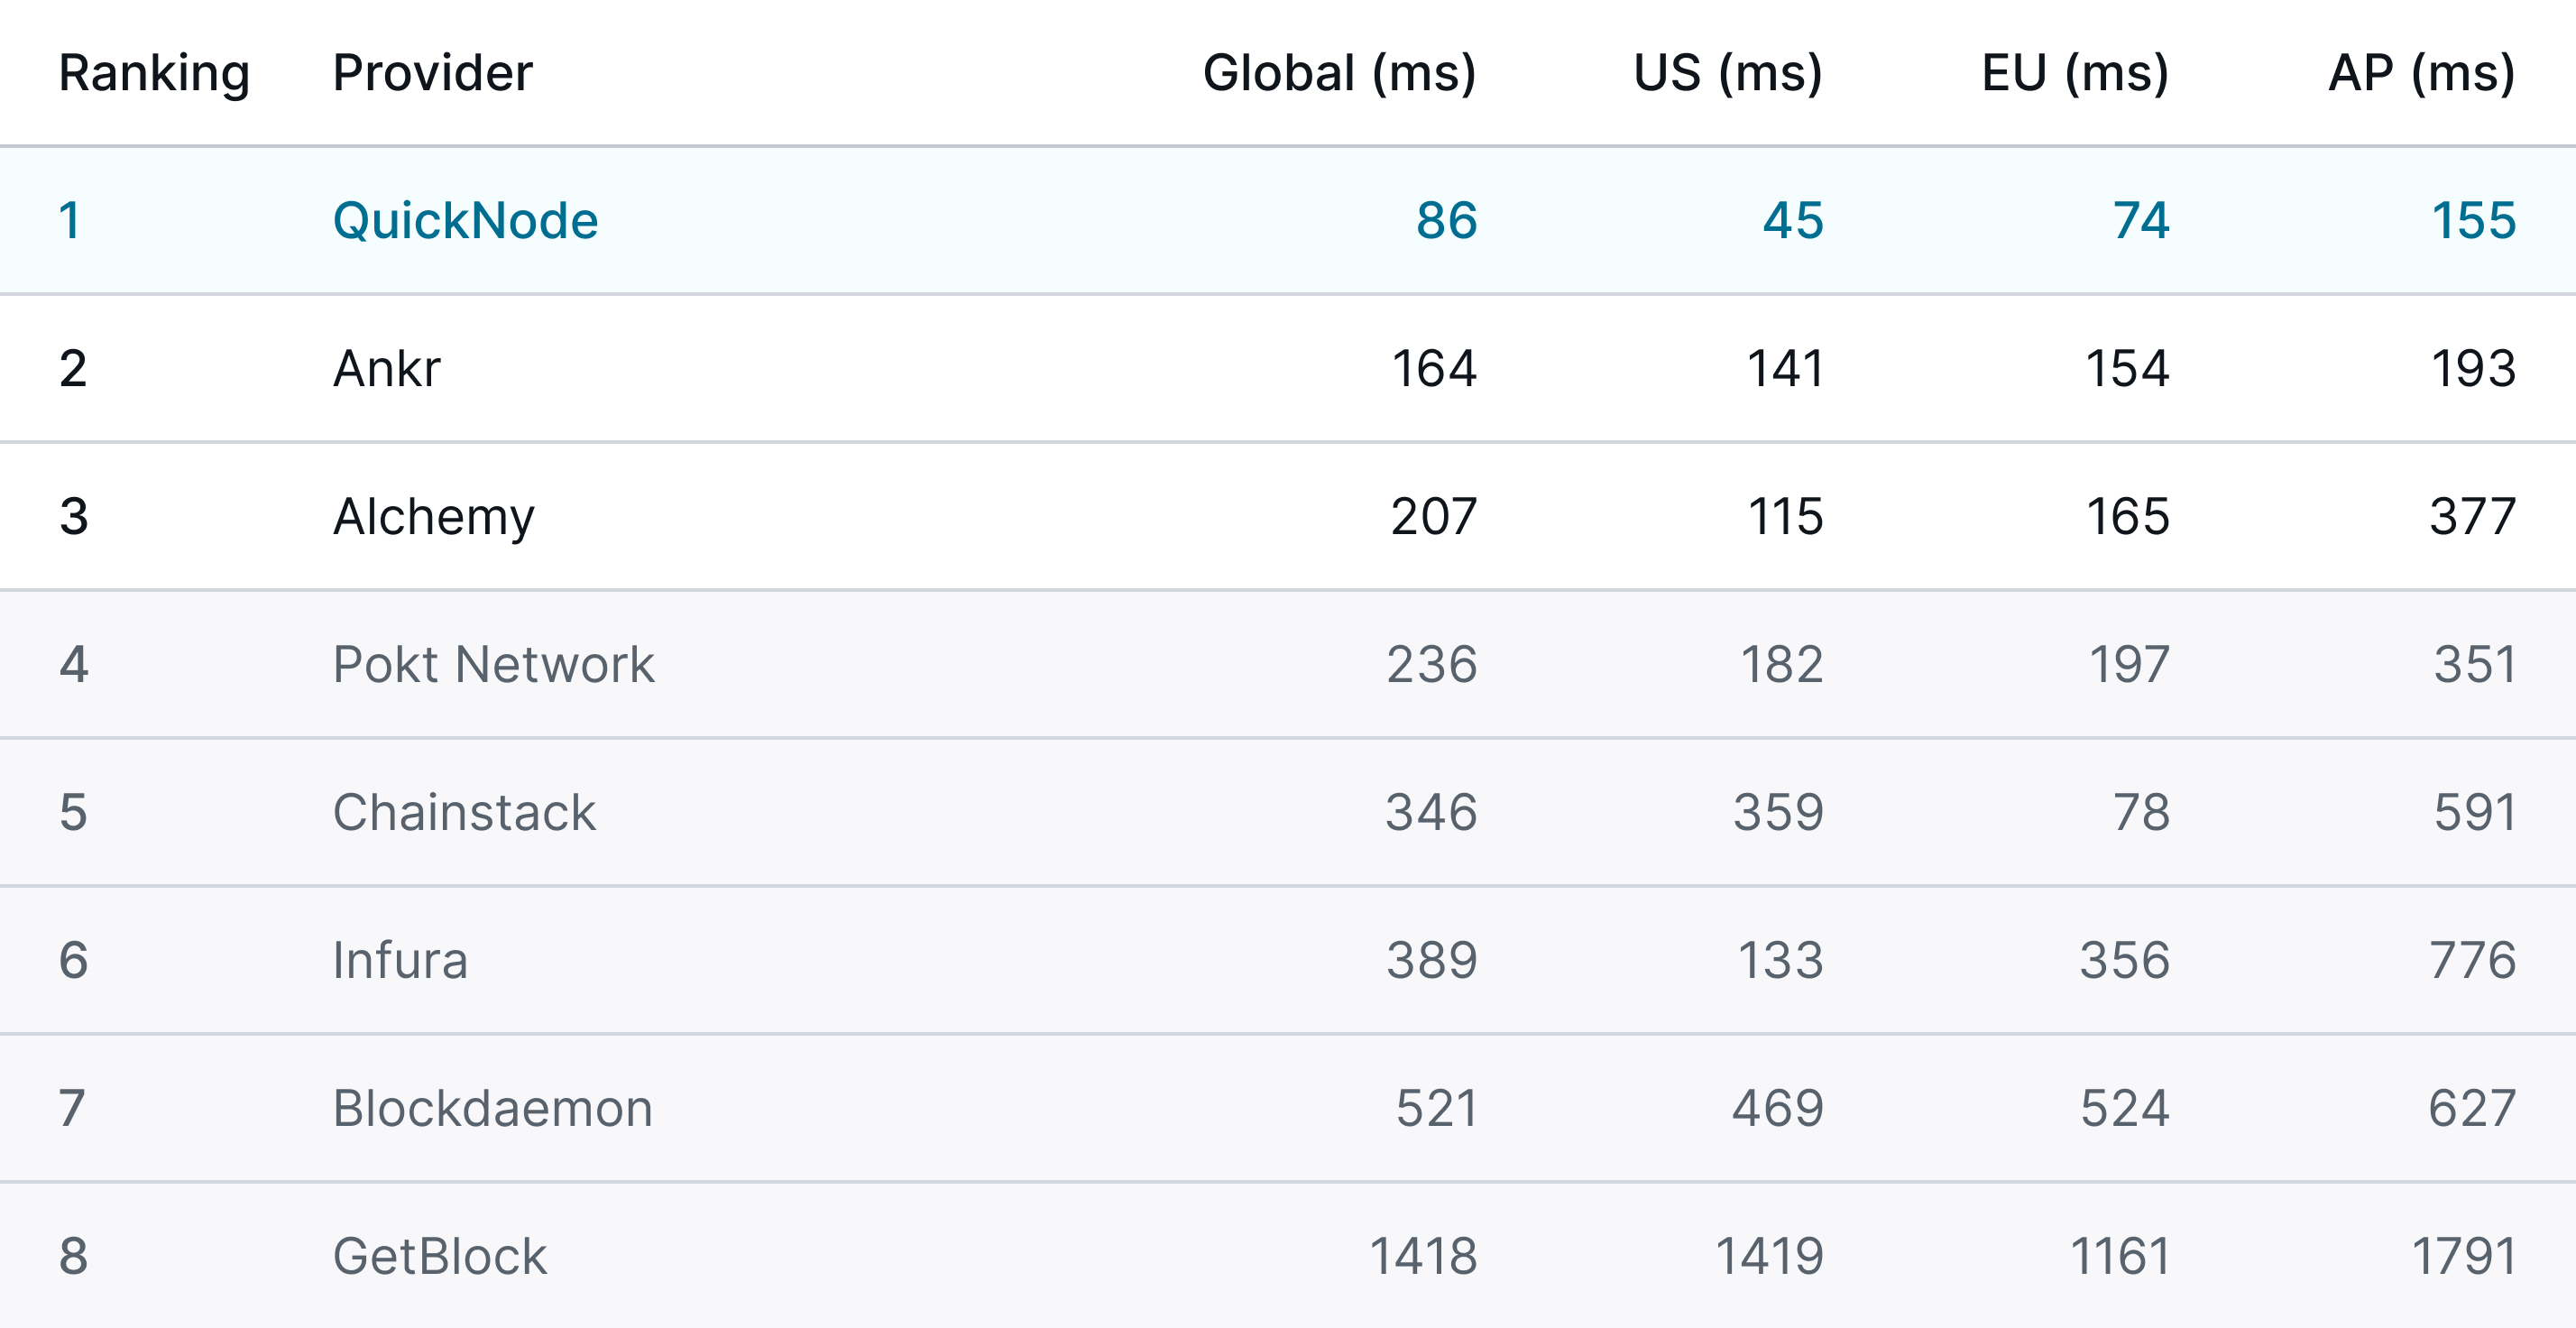
Looking at the global average response time, QuickNode triumphed with 86ms, followed by Ankr and Alchemy with 164ms and 207ms, respectively. Overall, QuickNode was almost 2x faster than the following best and 3x faster than the average response time of the rest of the providers, excluding GetBlock (254ms).
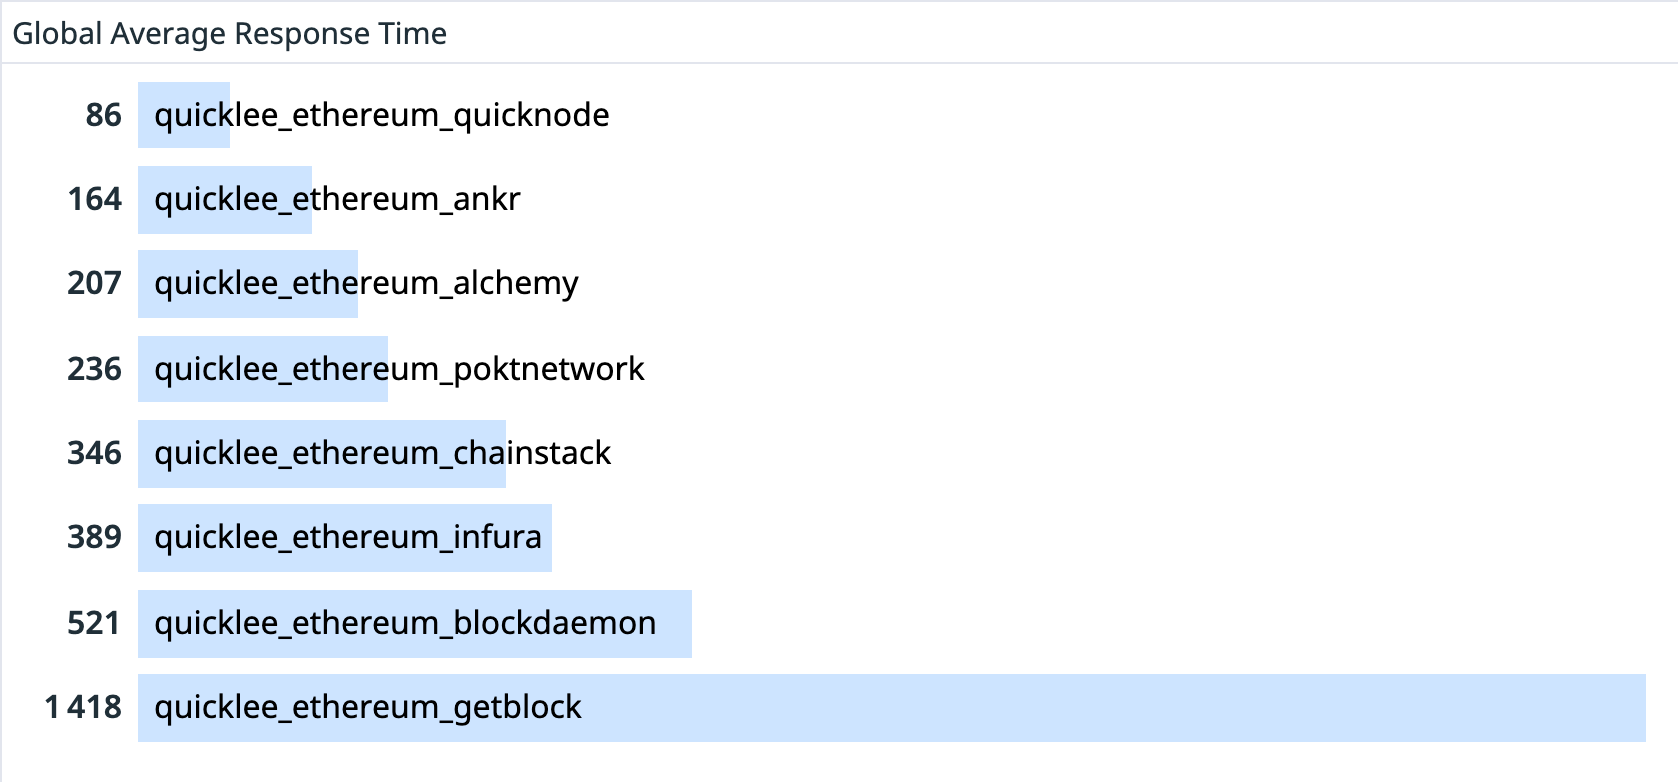
Not just that, QuickNode seemed to be the most stable with the slightest fluctuations globally.
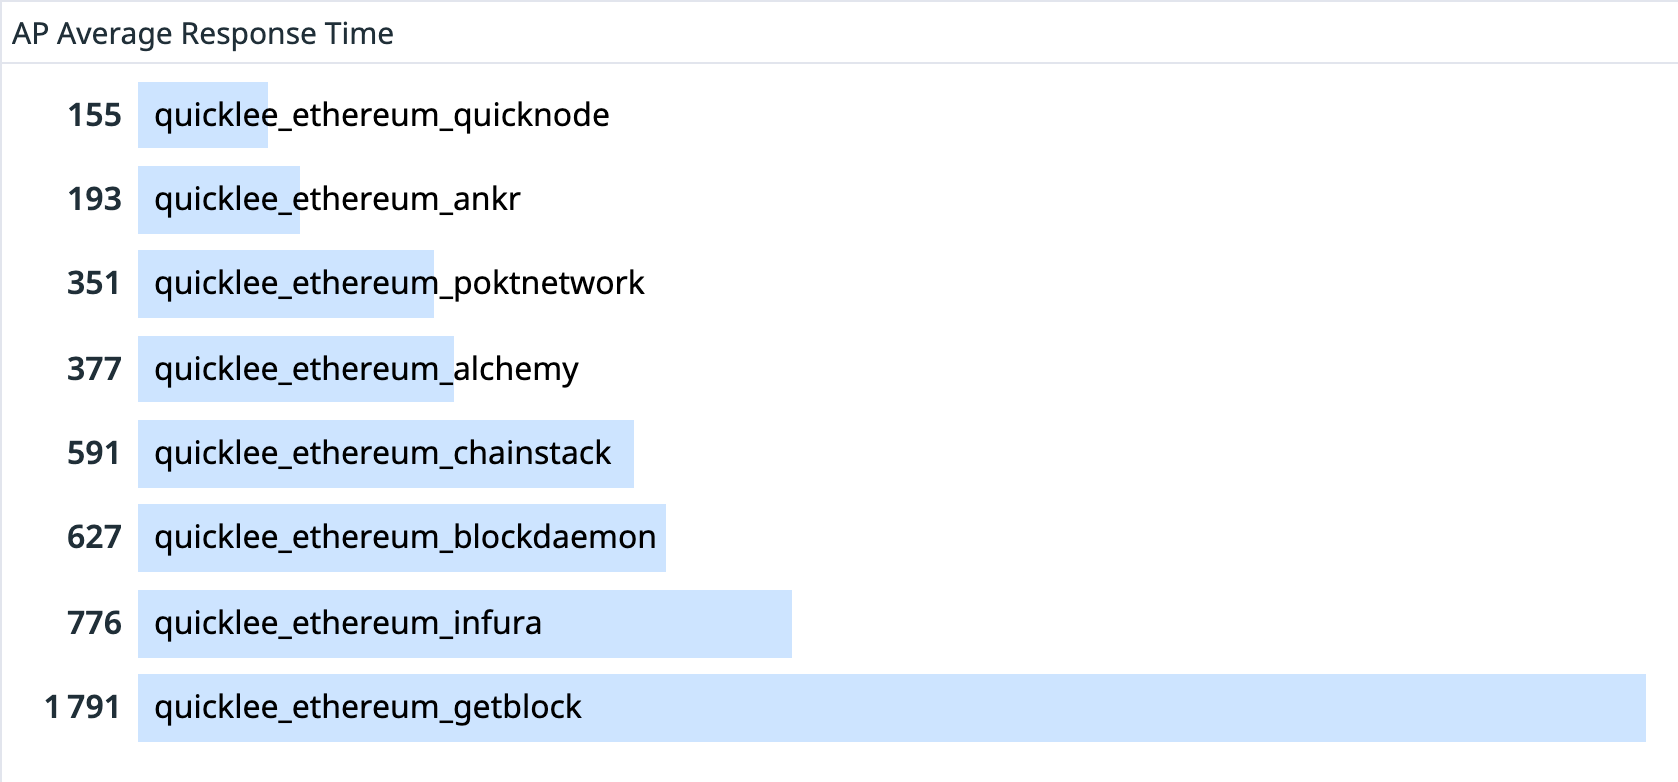
Regionally, QuickNode led the charge with an average response time of 45ms, 74ms, and 155ms in the US, EU, and AP, respectively. In the US, QuickNode was followed by Alchemy and Infura, with an average response time of 115ms and 133ms, respectively. In the EU, Chainstack gave tough competition to QuickNode with an average response time of 78ms, followed by Ankr with 154ms. In AP, most providers struggled with high response times — more than 200ms — except QuickNode, and Ankr, with an average response time of 155ms and 193 ms, respectively.
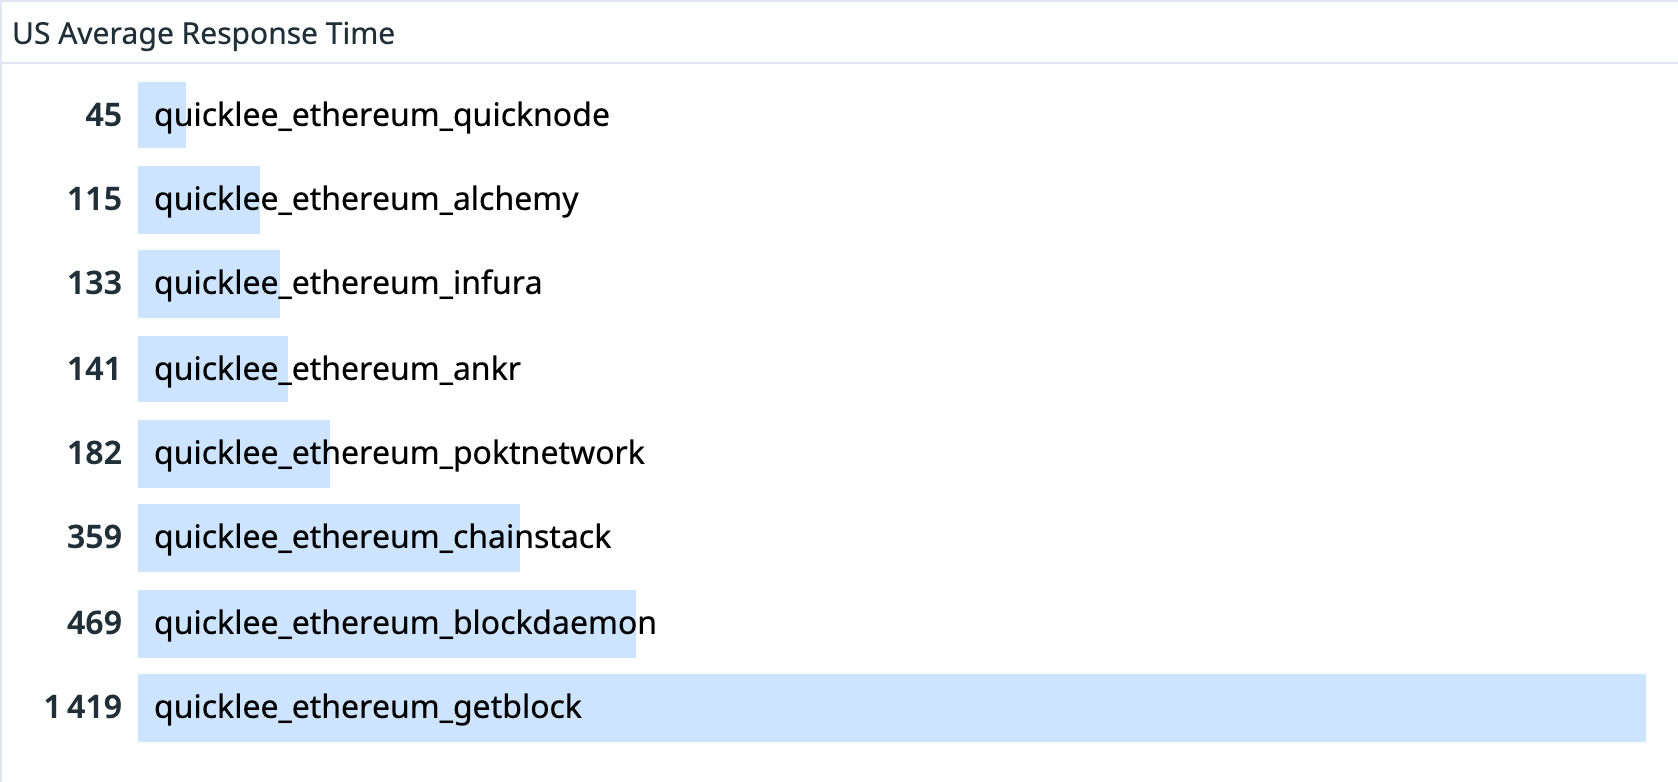
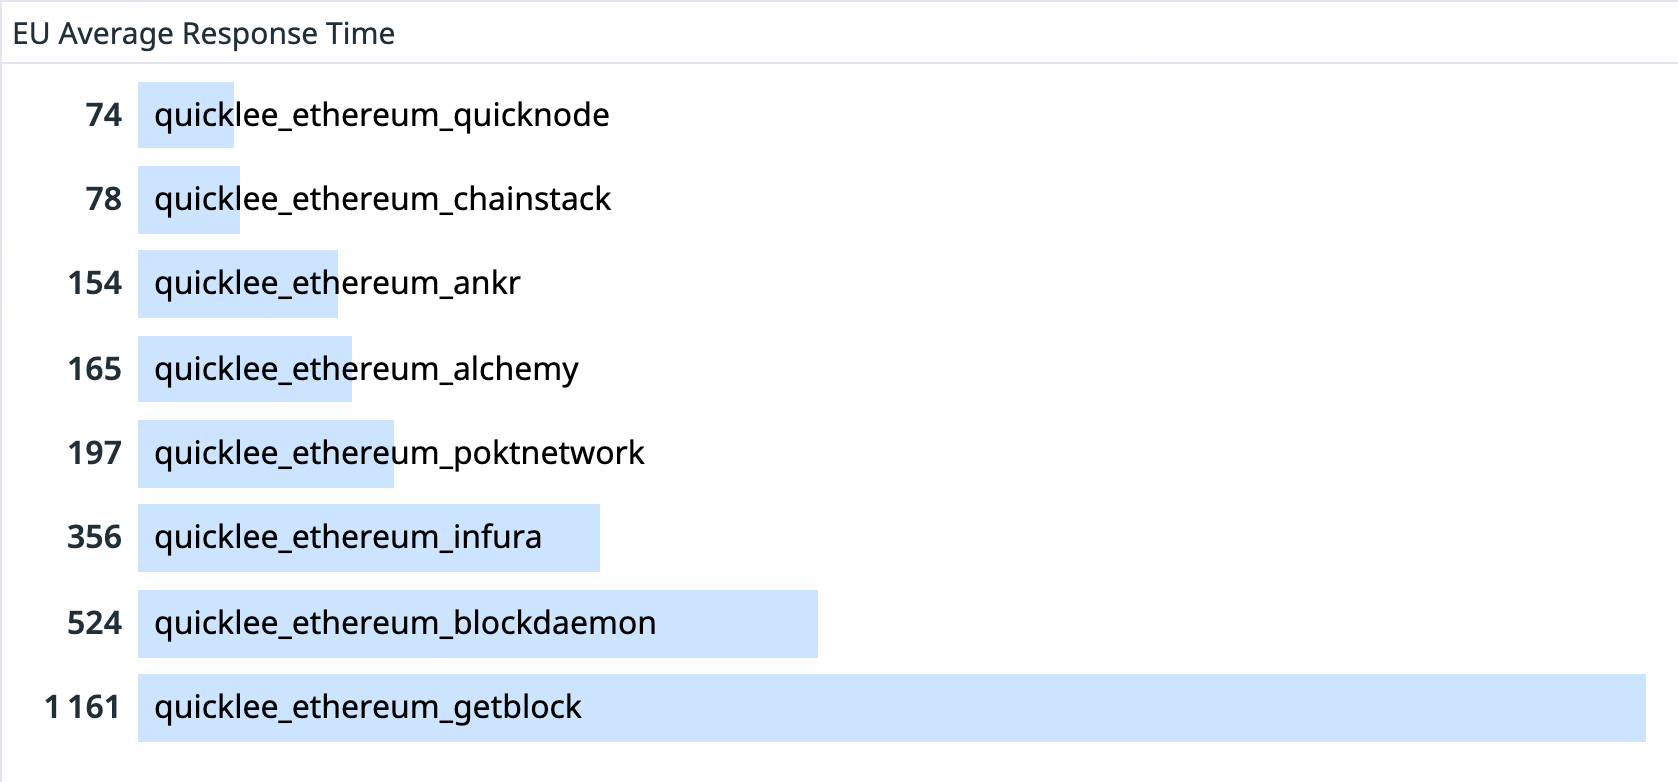
The results above show that QuickNode is the top performer globally and across all regions. Ankr and Alchemy exhibit decent performance following QuickNode; however, they are still far apart. Infura surprises in the US with an average response time of 133ms, while Chainstack surprises in the EU with an average response time of 78ms which is almost neck-and-neck with QuickNode.
QuickNode Provides the Fastest Response Times
For Web3 to gain mass adoption, the UX needs to be pushed to the next level. And that could only happen with highly-performant applications powered by the finest infrastructure and service — nothing short of the best!
As evident through the data, we can conclude that QuickNode is the fastest and most stable node provider (for Ethereum in this case study). In Europe and Asia-Pacific, it gets some competition from Chainstack and Ankr, respectively. However, the overall performance of QuickNode is unmatched, and it outruns the others. The exact test is running for Polygon and BNB Smart Chain, and the results outline the same conclusion (Live dashboards for all the chains are available in the Appendix).
Being an infrastructure provider and building an ecosystem around the same takes time, effort, and experience. The process of quantifying the quality of a service can only happen through data-driven decision-making and not by exhibiting biased numbers or throwing gimmicky keywords. Because eventually, these insights help us improve as an industry to support the builders — the end goal.
Lastly, the ultimate purpose here is to push the Web3 ecosystem forward. This exercise attempts to demonstrate a transparent, unbiased, and neutral perspective around the response time comparison of the blockchain node providers. Not only that, one of our objectives is to promote an industry-wide discussion about how we can align and take this forward together — we are all ears!

Why QuickNode?
QuickNode is an affordable, globally-distributed, multi-chain, multi-client, premium Web3 infrastructure provider. QuickNode powers industry leaders like Coinbase, 1inch, MagicEden, Exodus, and Nansen, to name a few and serves around 7 billion API requests per day (at the time of writing this article). Here's why businesses choose QuickNode for Web3 infrastructure!
Also, QuickNode is not only a node provider but an ecosystem in itself with a full suite of blockchain APIs — Core API, Token API, NFT API, GraphQL API — and the first of its kind, blockchain API Marketplace.
We say do your stuff — build — and let us take care of the rest!
About QuickNode
QuickNode is building infrastructure to support the future of Web3. Since 2017, we've worked with hundreds of developers and companies, helping scale dApps and providing high-performance access to 23+ blockchains. Subscribe to our newsletter for more content like this, and stay in the loop with what's happening in Web3!